Create Dashboard Projects for all of your customer experience initiatives and combine all of your experience data including survey responses, tickets and conversations within a single dashboard. Compare locations, channels and touchpoints. Drill-down an action feedback to improve customer experiences and operations.
Being able to take a deep look into the data collected from customer feedback is essential to running a successful customer experience program. In this brochure you will learn the importance of data collection, why it should be analyzed and the importance of using this data to make decisions. Learn more about Dashboard Projects, Scoreboard Projects and the importance of Dashboard Drill Downs. To learn more about the benefits of Loop Insights click the button below.
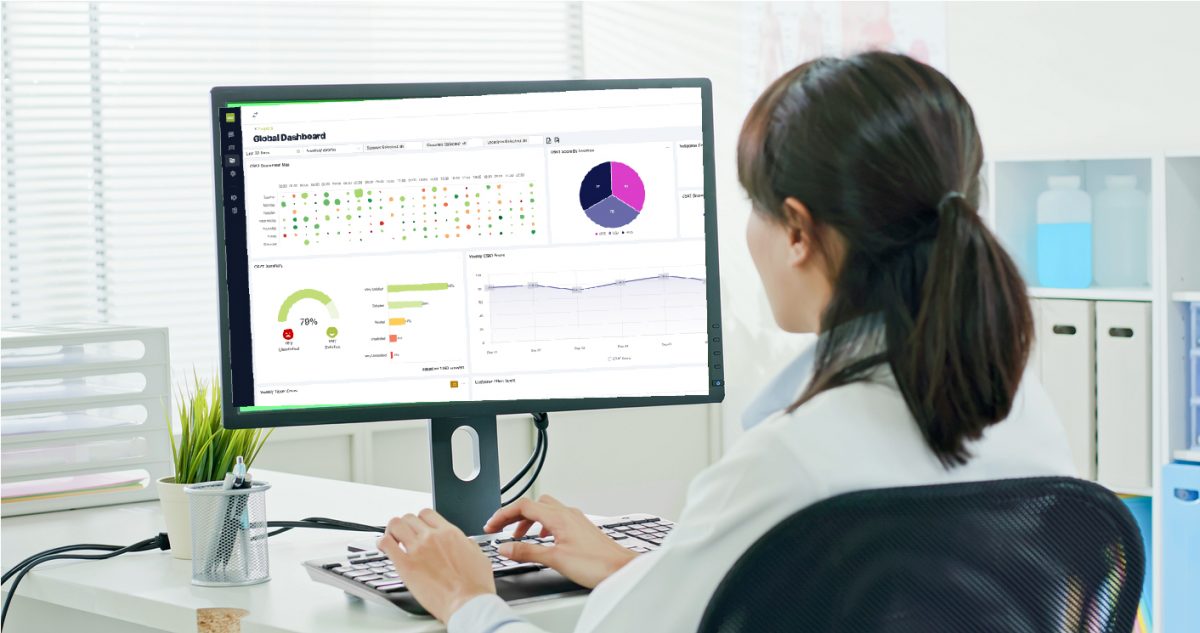
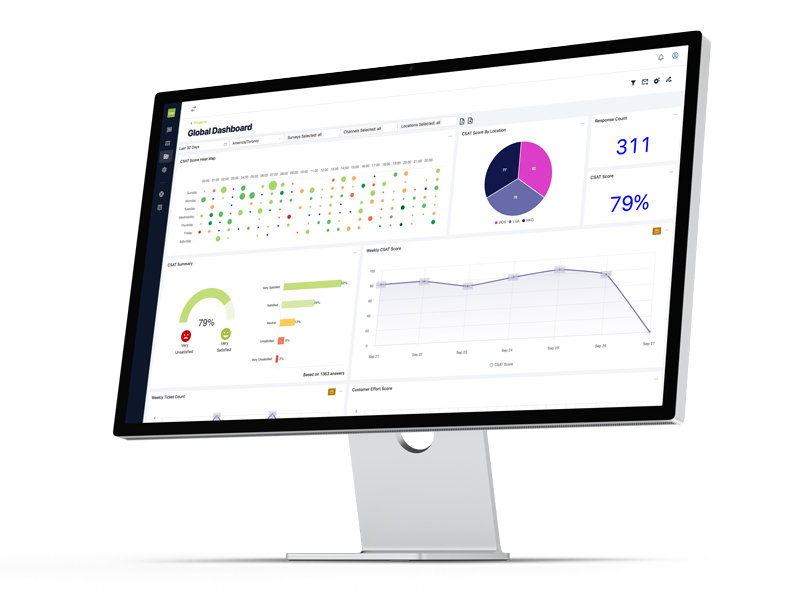
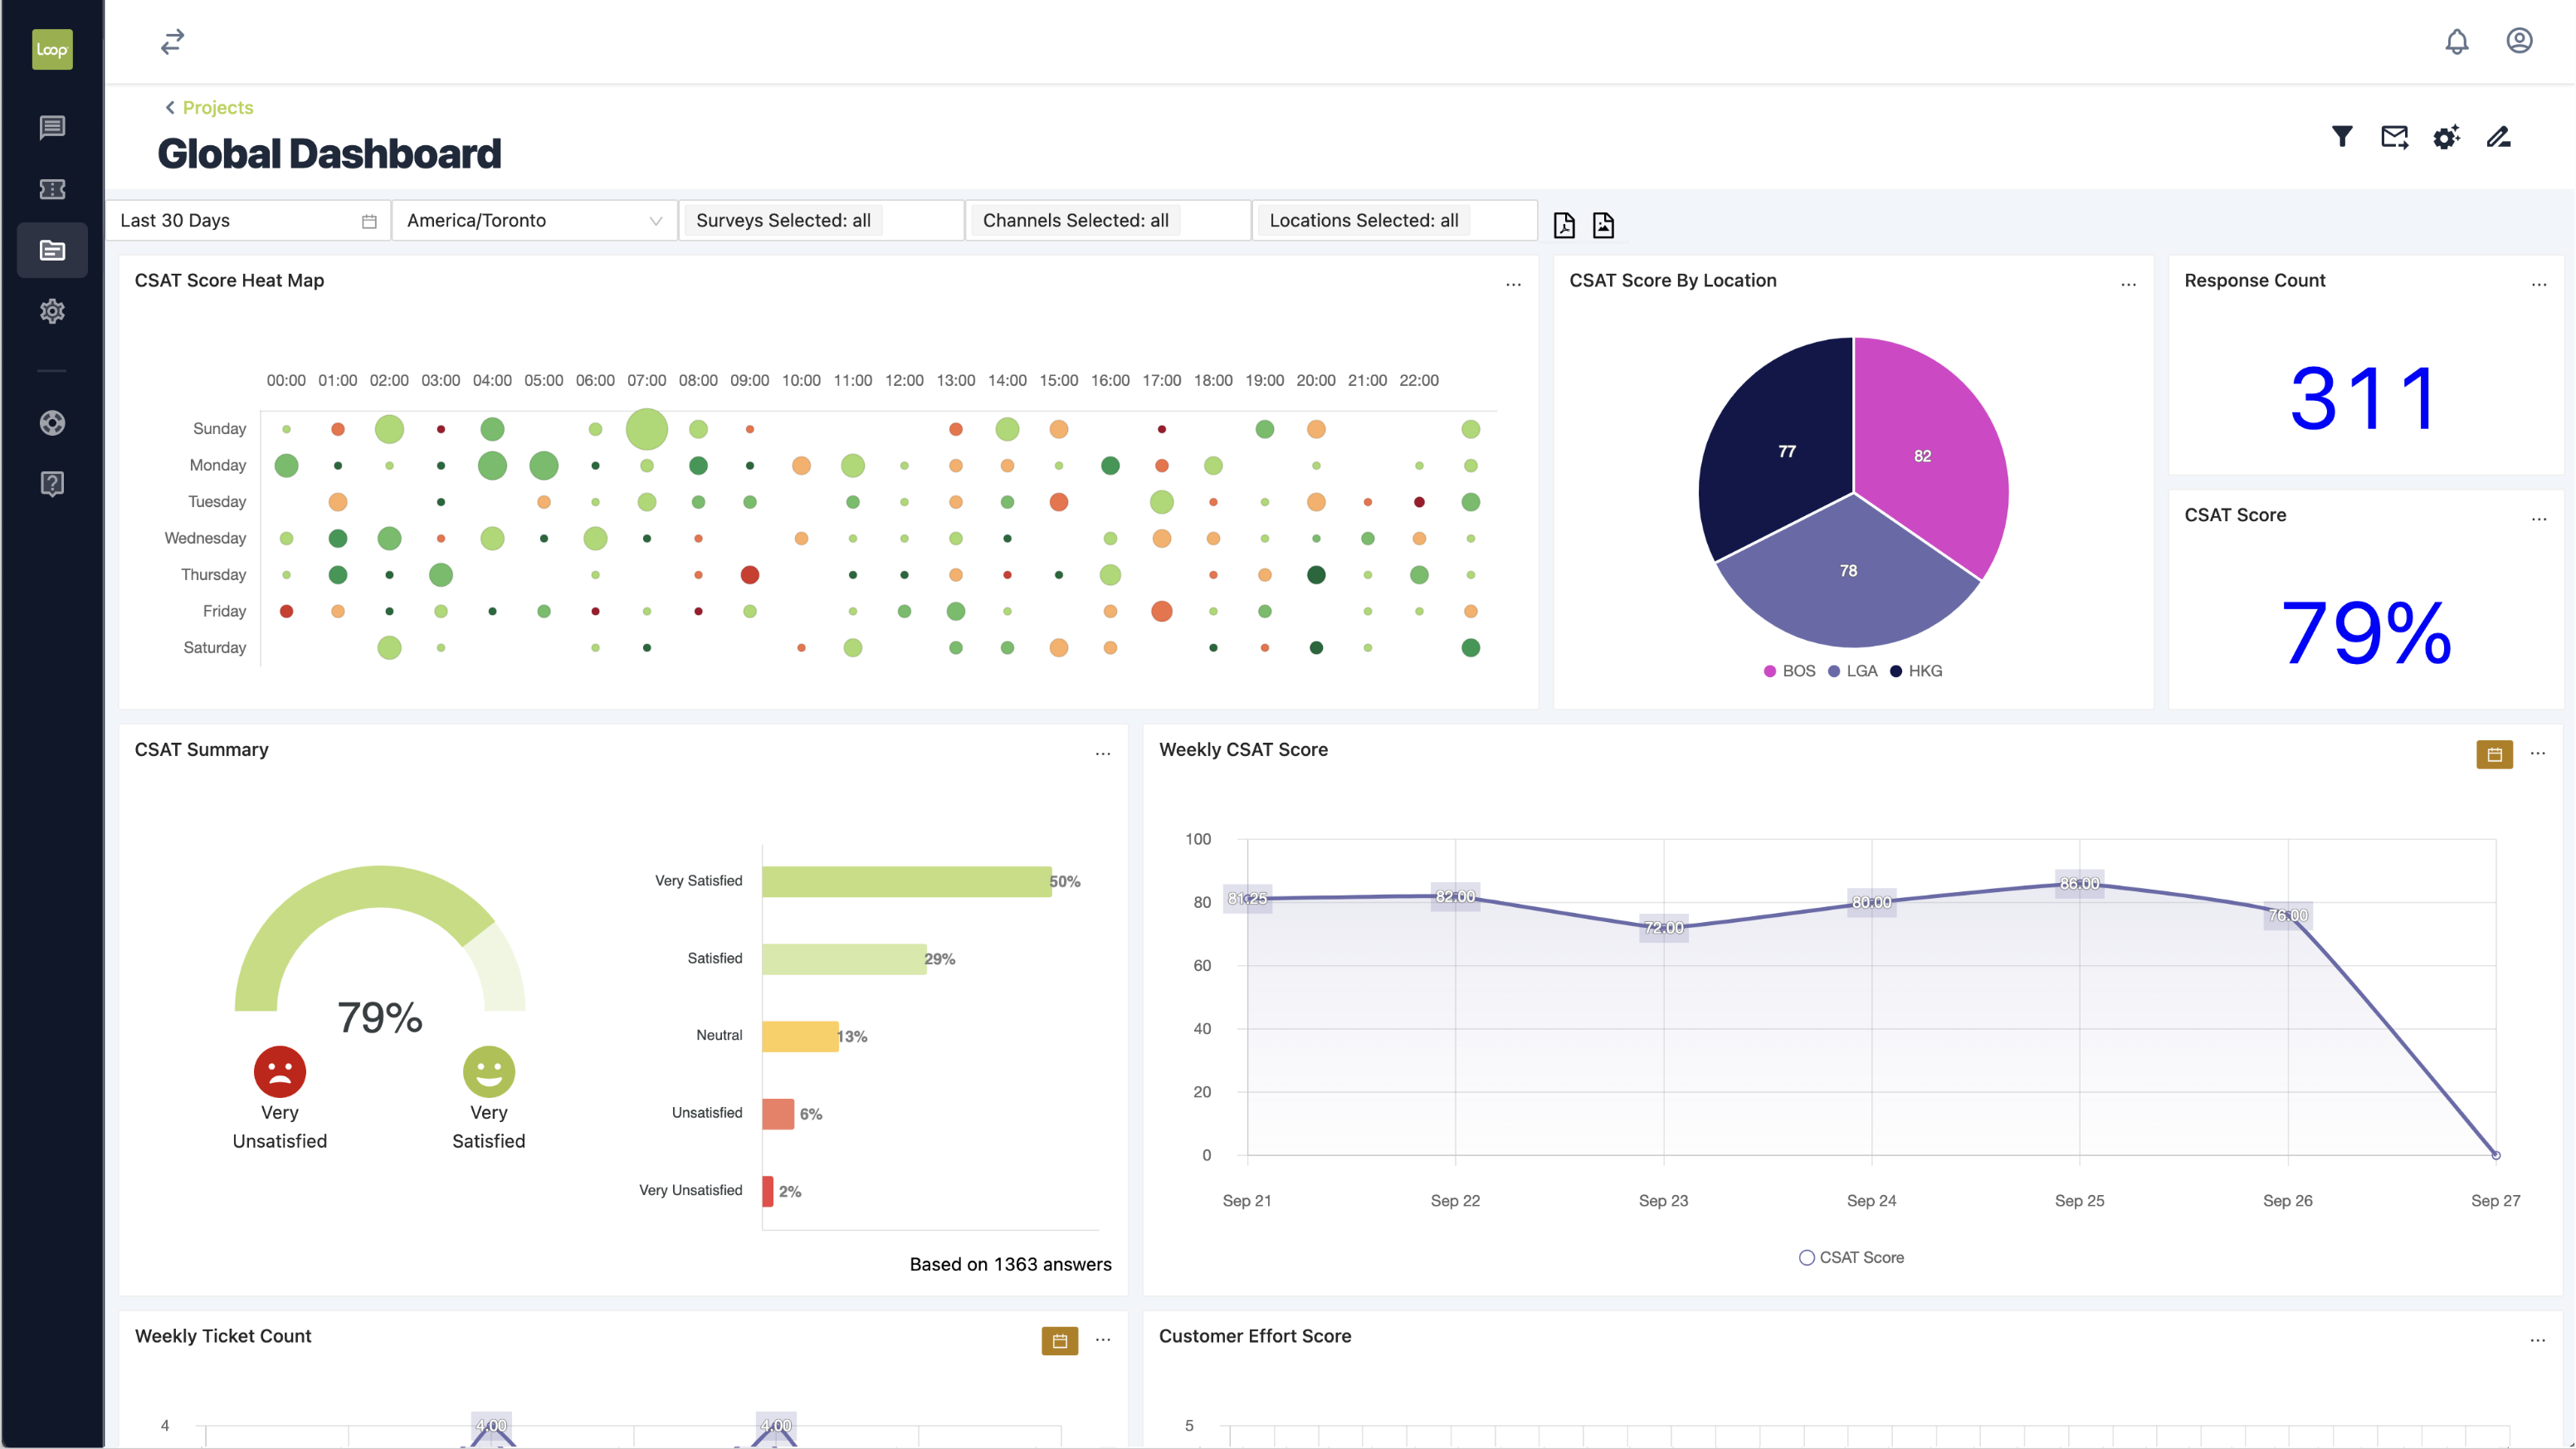
Dashboard Projects allow you to view the data from a project with the Loop® Experience Platform and easily analyze the results. This data will provide greater insights and help to determine the root cause. It will also provide a consolidated view of the responses you are seeing for a quick snapshot of the results that have come in. Build custom dashboards for each role and location to ensure optimal insights from each touchpoint. This allows you to easily visualize the data through graphs, tables and charts. Dashboards Projects can be easily exported into PDF reports for additional productivity.
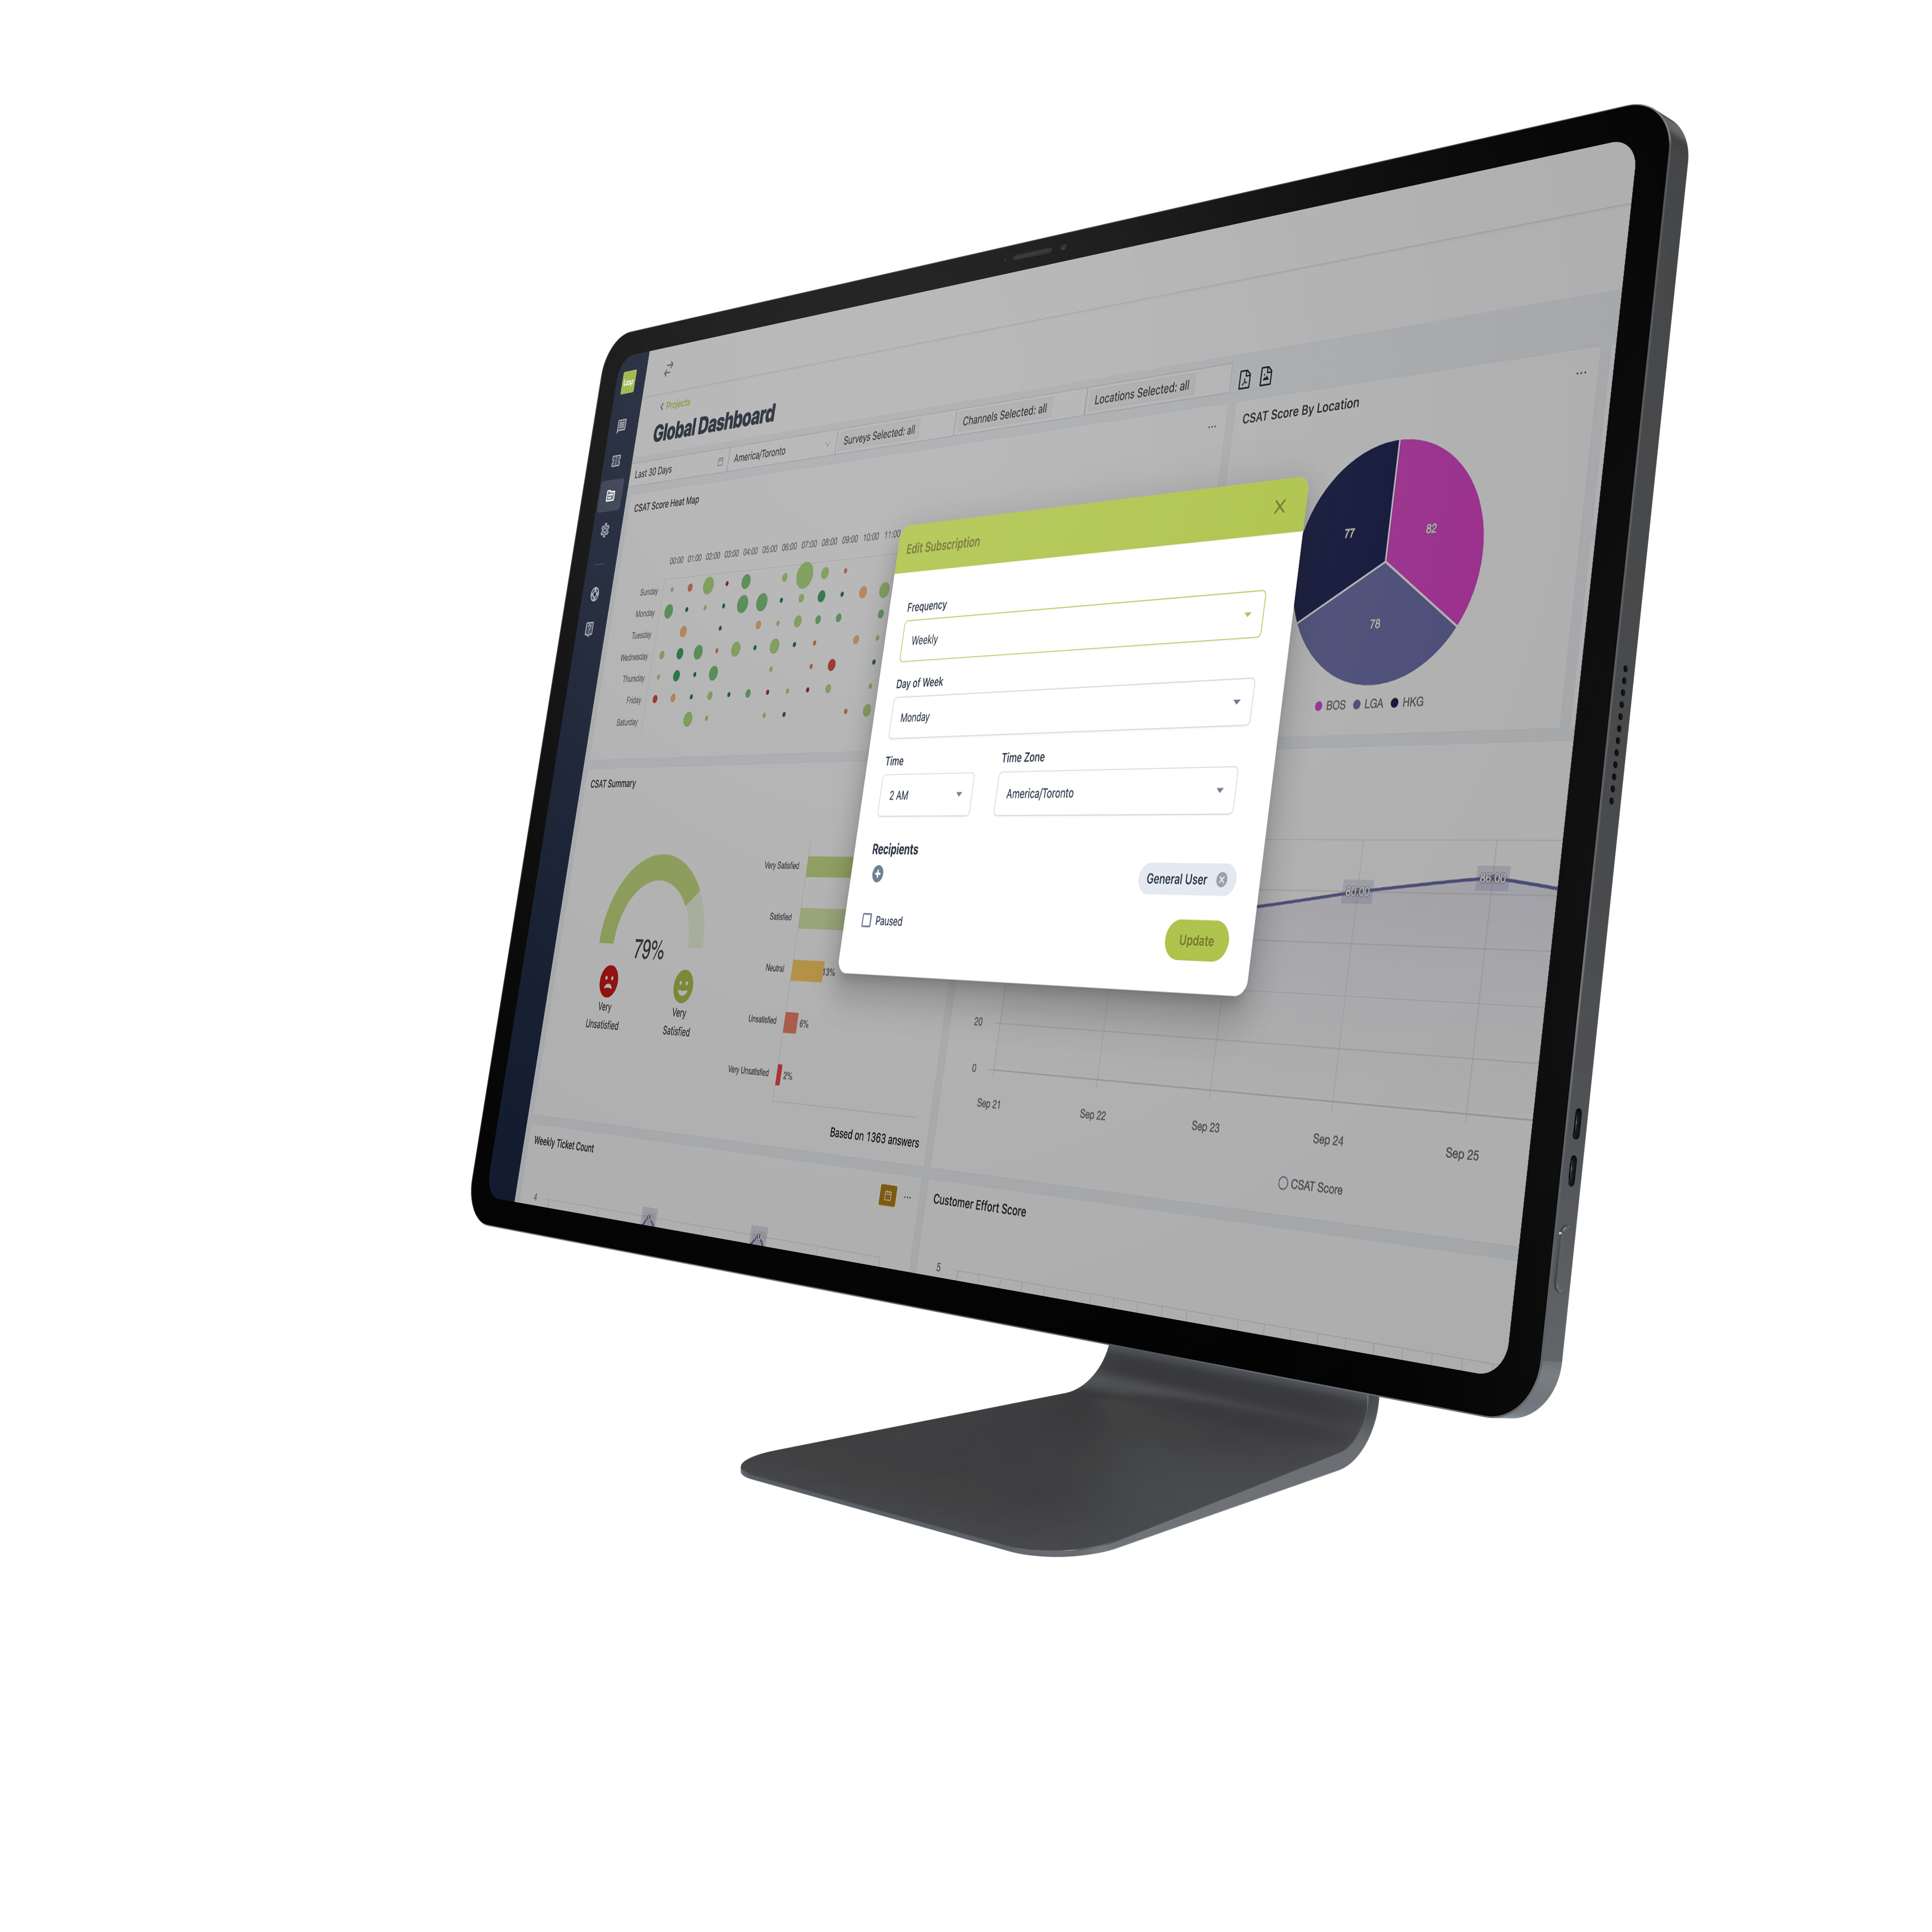
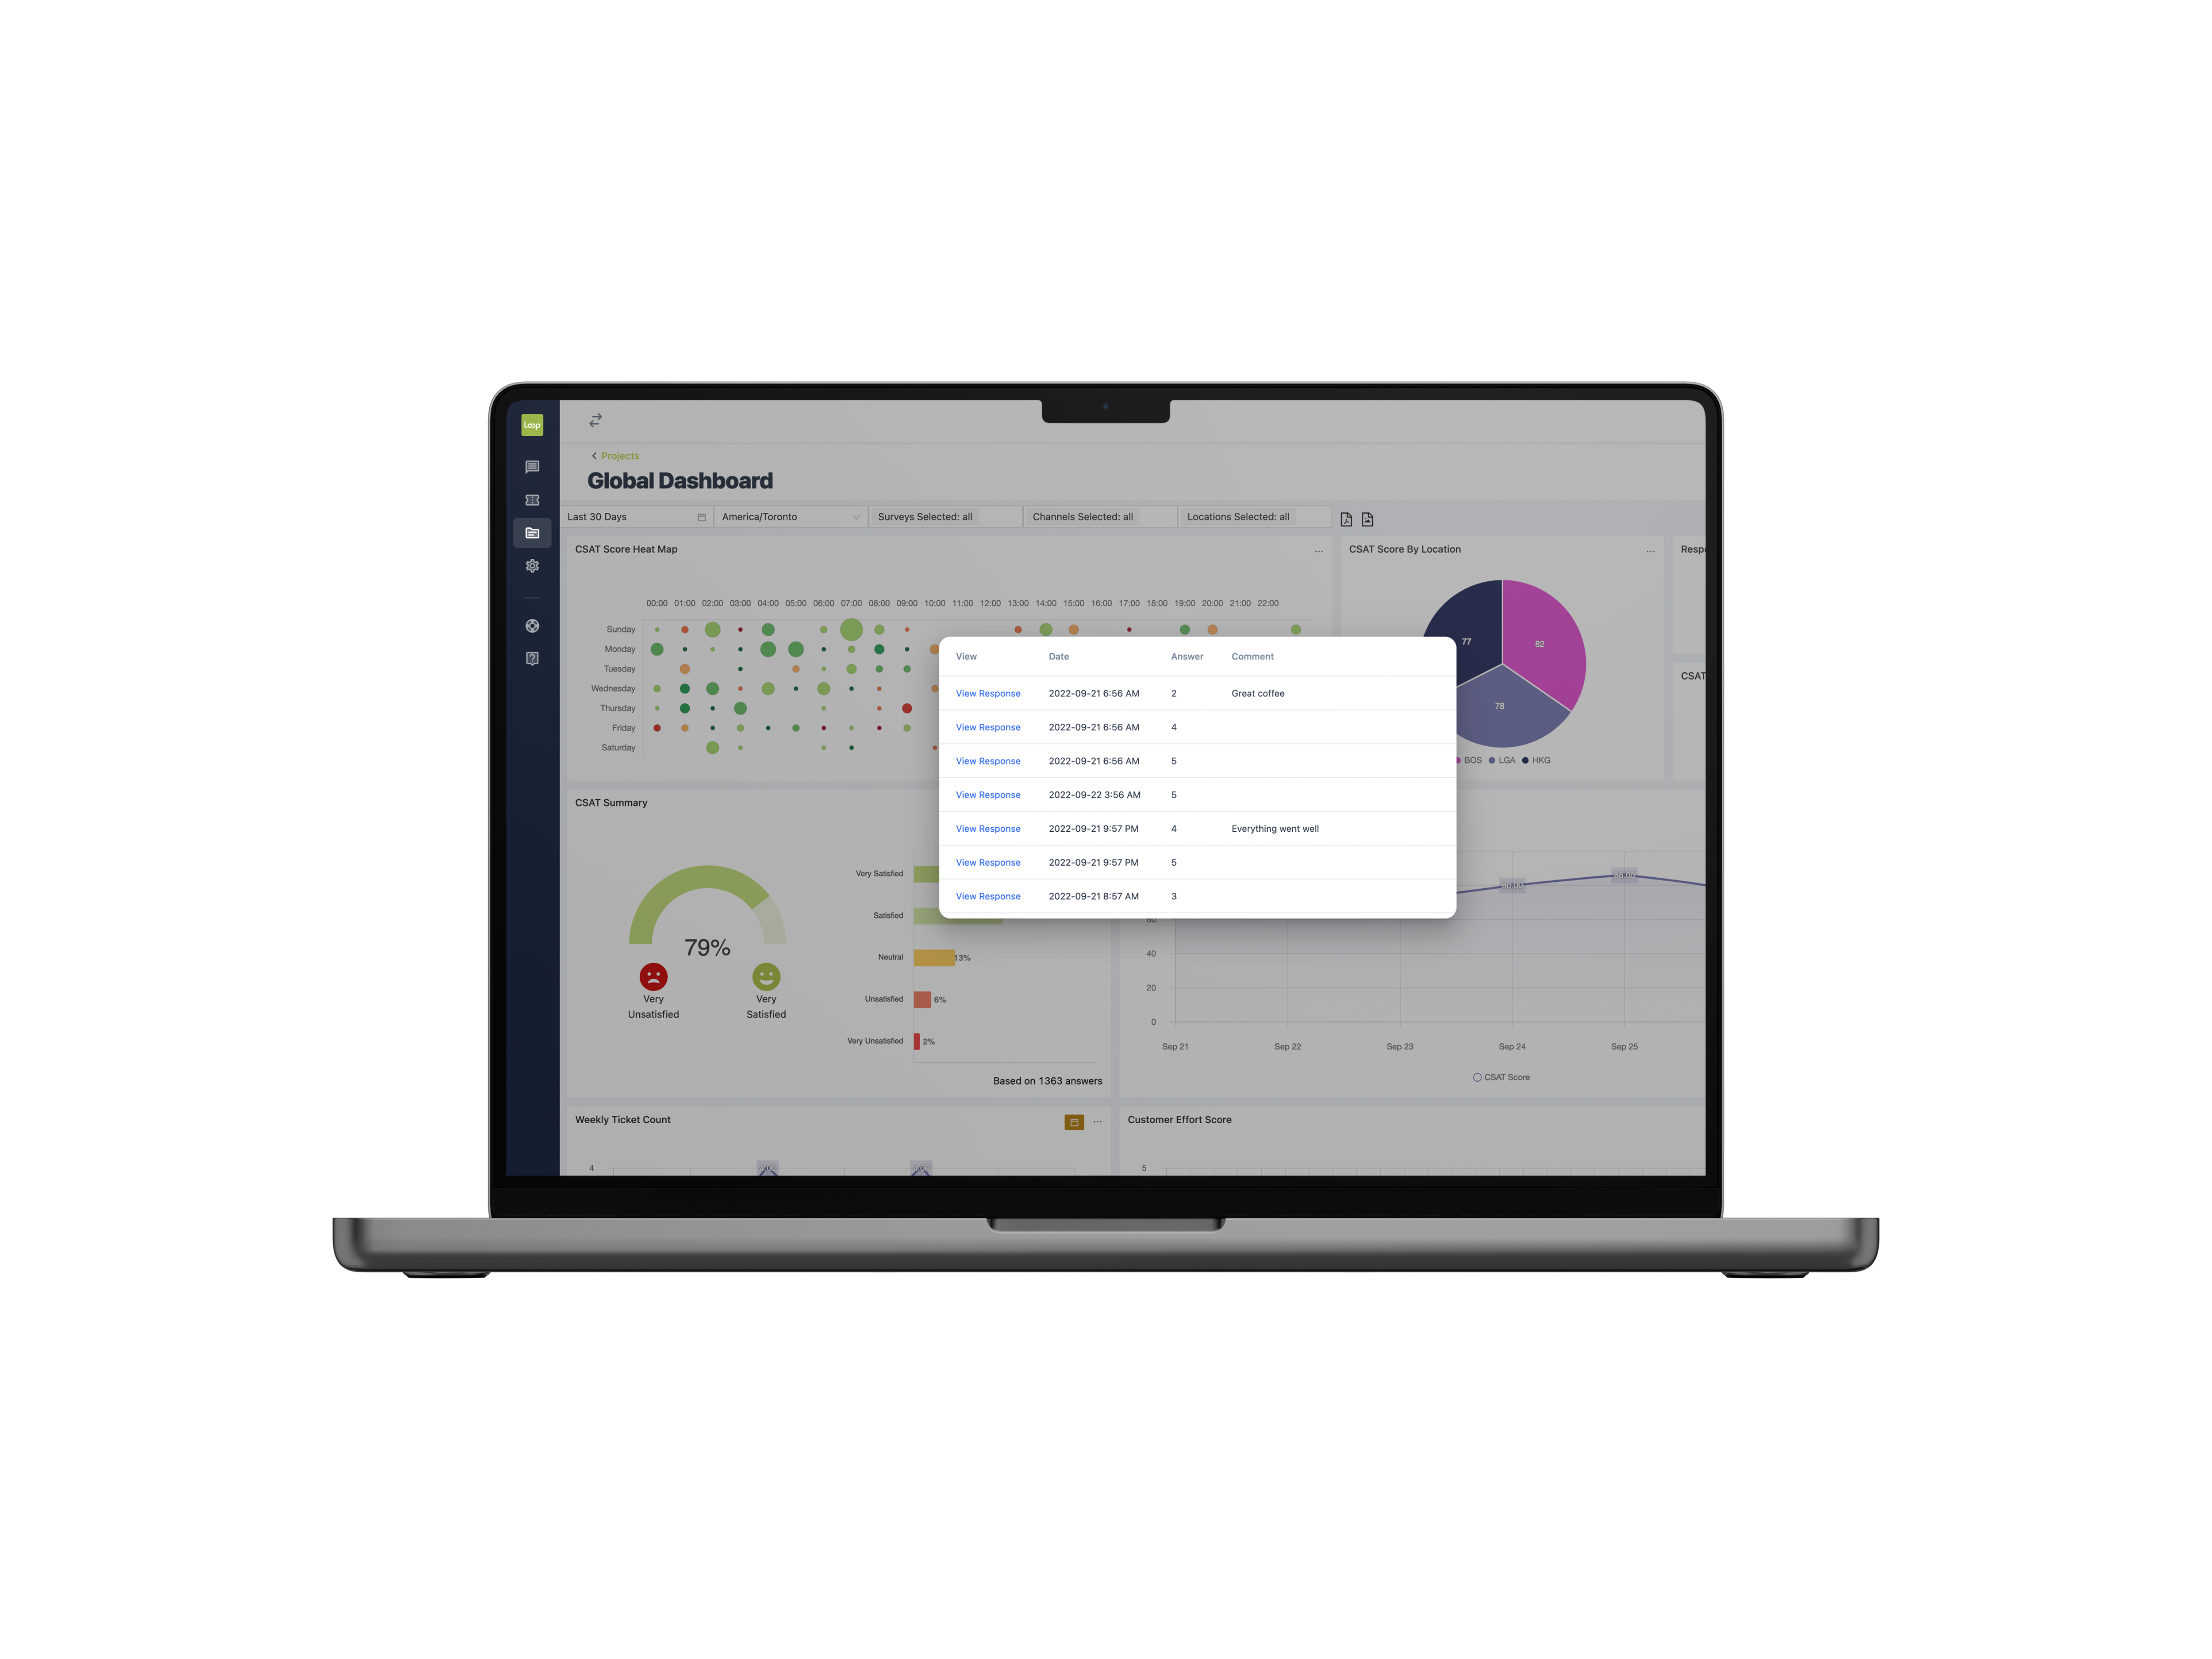
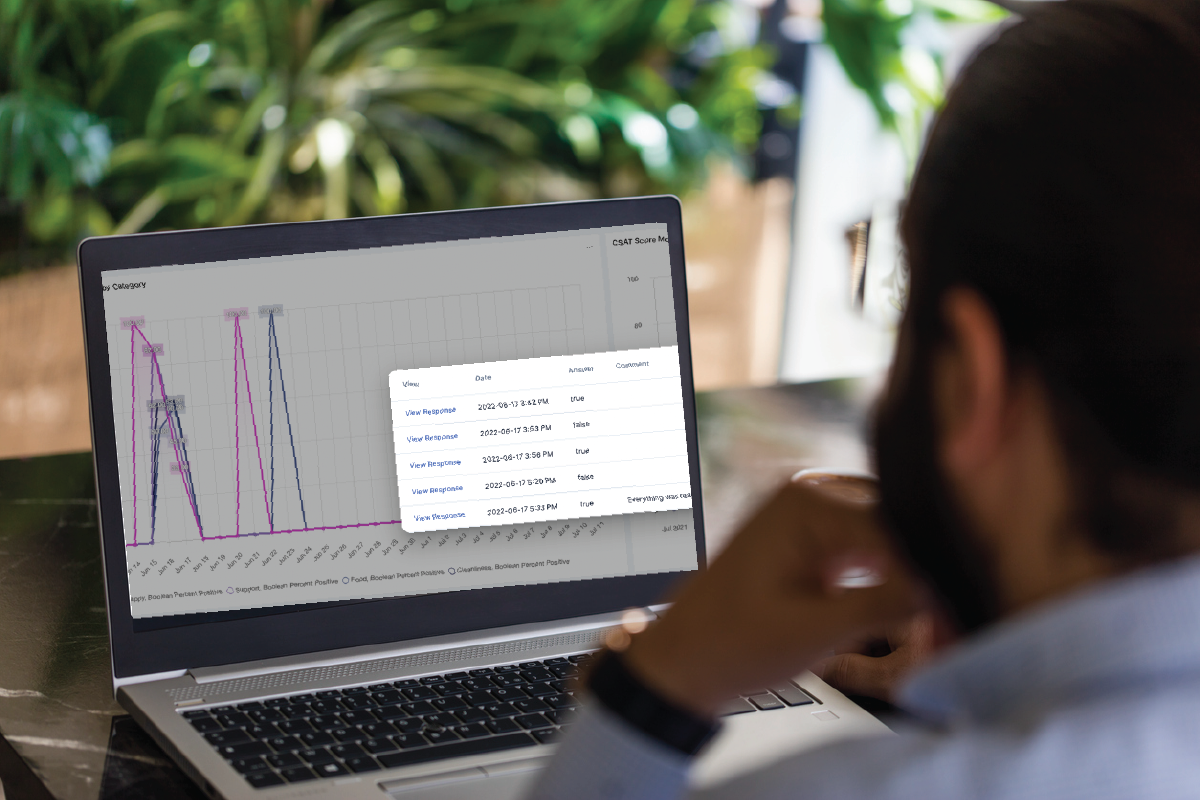
Dig deeper into your data by using dashboard drill downs for your survey projects, tickets and conversation data. This will help you understand where the overall results come from and provide a summary of the individual results. You can navigate drill downs by clicking the data point to view all the responses in the desired dataset. This can help you better understand the data in your dashboards and allow you to make better business decisions.
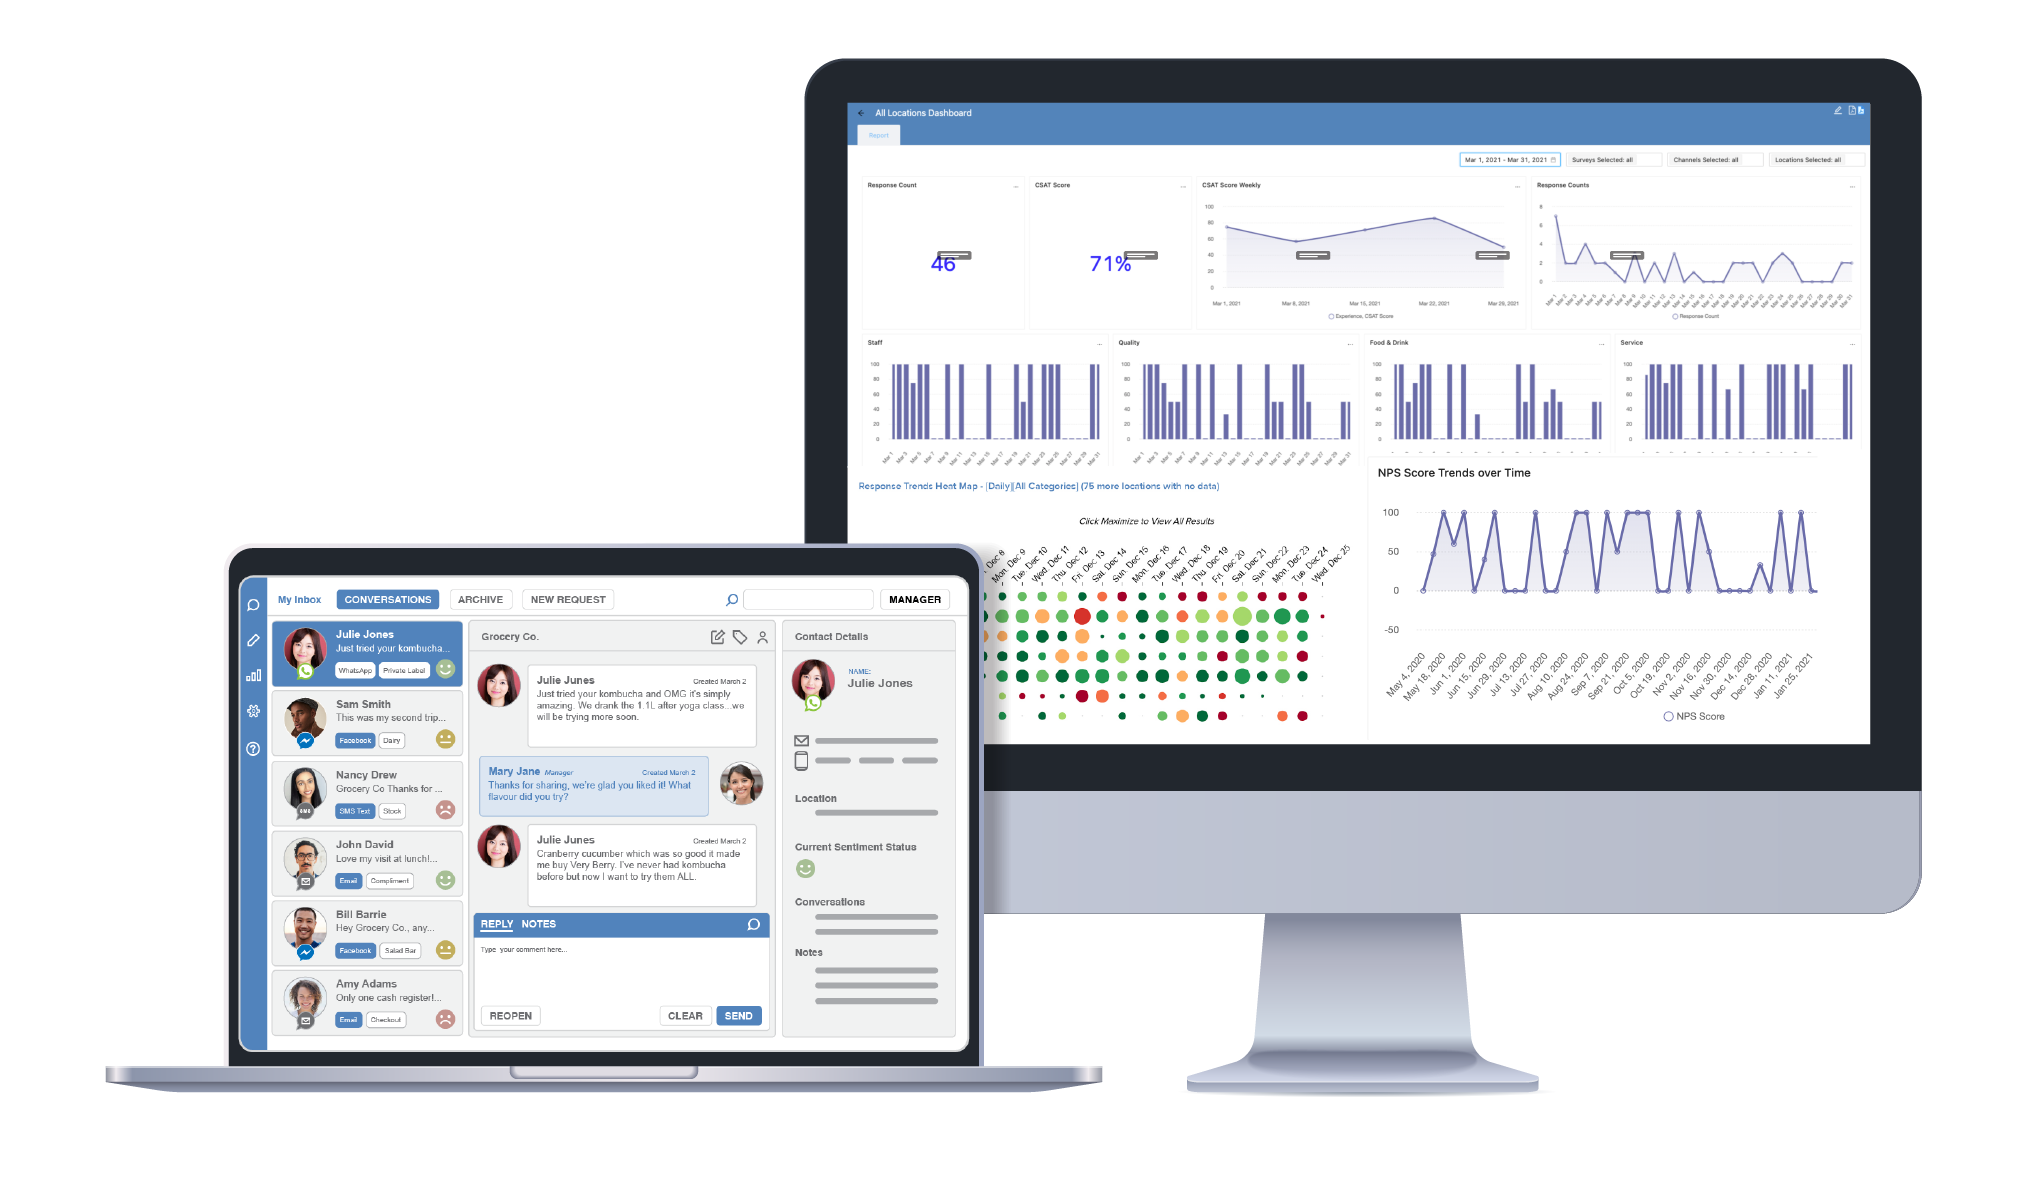
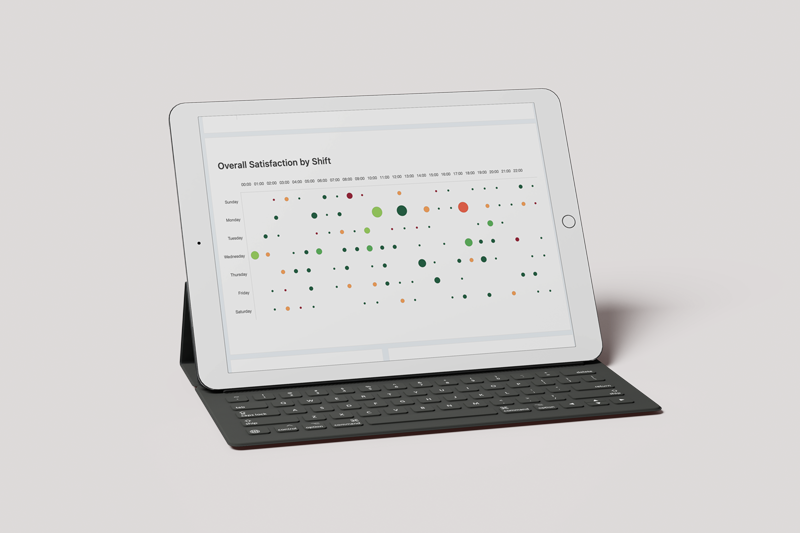
Heat maps are a great way to view your data, and present a unique view to operators and executives. It displays different variables along the x and y axis and the size of the dot indicates the quantity of responses. The colour of the dot (green/yellow/ red) indicates how positive the responses were. High scores are indicated with a dark green dot, while low scores are indicated with a dark red dot. Heat maps are a unique way to quickly understand when you collect the highest volume and problematic feedback.
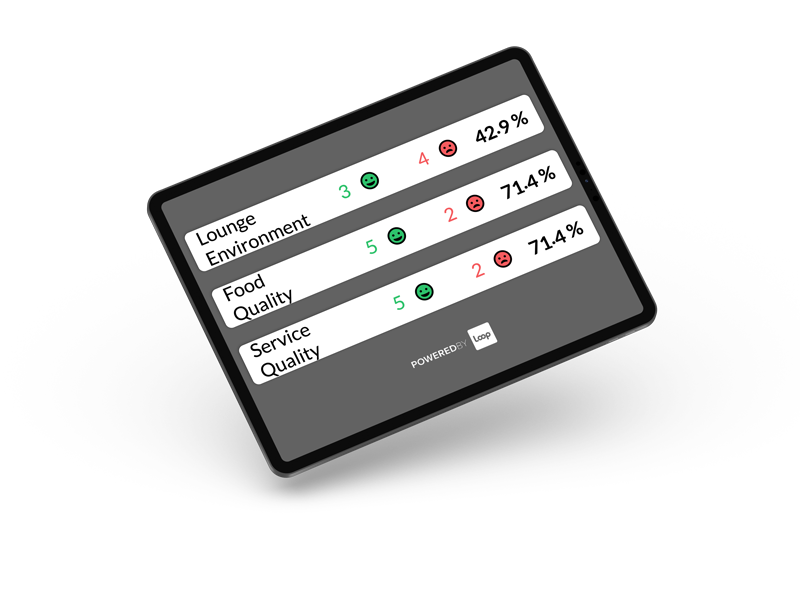
Today, the majority of customer experience programs focus on providing mangers and executives with data to make strategic decisions, however; frontline employees need data too. Scoreboard Projects allow the customer experience data that relates to loyalty, satisfaction and effort, to become part of your overall culture and promote transparency with frontline staff.
Most customer experience solutions offer nightly data uploads resulting in a significant delay of data collection, interpretation and action. With the Loop Experience Platform you can share feedback in real-time and recover customers in-the-moment. Scoreboard Projects are great for streaming live customer feedback each shift resulting in higher employee productivity and reduced customer churn. The scoreboard resets each day at midnight, allowing the scores to be reflective of the daily performance. These factors contribute to a positive and motivated employees, resulting in a positive workplace environment.

Easily obtain overall summaries of daily scores and deep dive into each location based on their scores. These scores can be summarized by loyalty, satisfaction and effort. This will help to ensure that frontline employees can make an impact on the daily score and strive to increase the daily metrics, and drive results.
Gain insights into the data you have collected is key to understanding the “why” behind the data. The Loop Insights add-on product allows your data to work for you and can be used to drive business decisions.
View both local and global results, allowing upper management to compare local results to the overall global results.
Measure KPI’s and track how well you are performing over time. This will help to determine which area’s require improvements.
Gain customer experience feedback in the moment to either pivot the customer service or continue based on data collected.
Track trend performance over time to determine what aspects of your business are performing well and what area’s require review.
Gain valuable insights and make decisions based on up to date customer feedback to better your business.
Use customer data to set future goals and determine where improvements can be made and what customers appreciate.
Discover why customers prefer your brand and what sets it apart from competitors, and how to ensure high customer loyalty.
Create reports for stake holders, providing them with data driven results and customer data to make future business decisions.
By having visualization of reports, you can quickly interpret the data and produce reports in a timely manner.
With customer driven data, you can determine which products to promote, and what to change about low performing products.
Deep dive on collected data and making changes based on that feedback, customers will know that you value them.
By providing frontline staff with in-the-moment feedback, they can be motivated to give excellent customer service.
Loop Feedback uses surveys to collect feedback from customers. This provides feedback about your business and essential for tracking KPI’s. This data can be collected through multiple channels. Use this data to make informed decisions and close the loop on feedback provided by customers.
With Loop Messaging, it is easy to follow-up with customers in real-time on the customer’s preferred channel of choice including SMS and email. Responses are pushed directly to the inbox along with the customer’s contact details so you can start the conversation, improve response times and improve customer retention rate.
With Loop Tickets, enable customers and staff to create tickets that need to be addressed from on-site staff. This will bring potential issues to management’s attention quickly and can be addressed based on level of priority. By addressing issues in a timely manner, it shows customers you care about the facility.