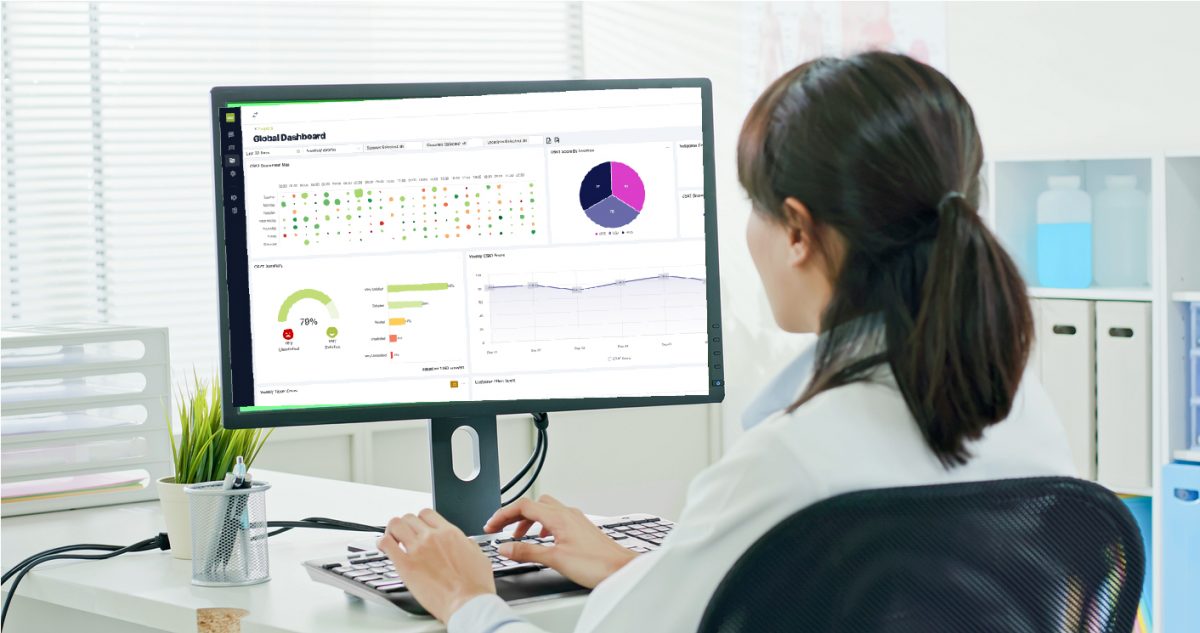
Dashboards are a quick glance Key Performance Indicators (KPI) from a website or survey typically displayed in a series of graphs and number overviews. It will indicate how well these KPI’s are performing and if they have increased or decreased in a particular time period.
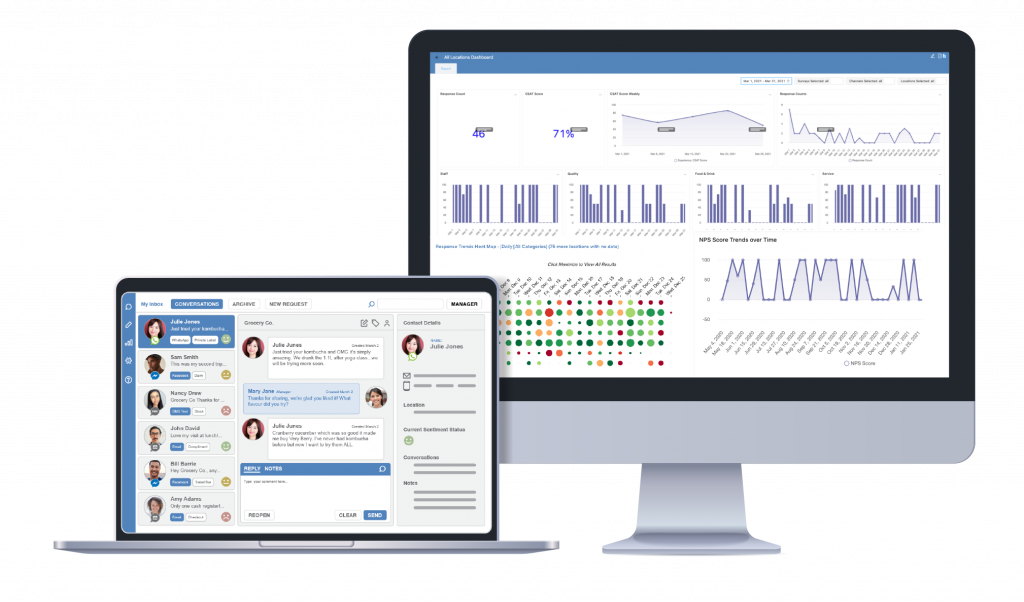
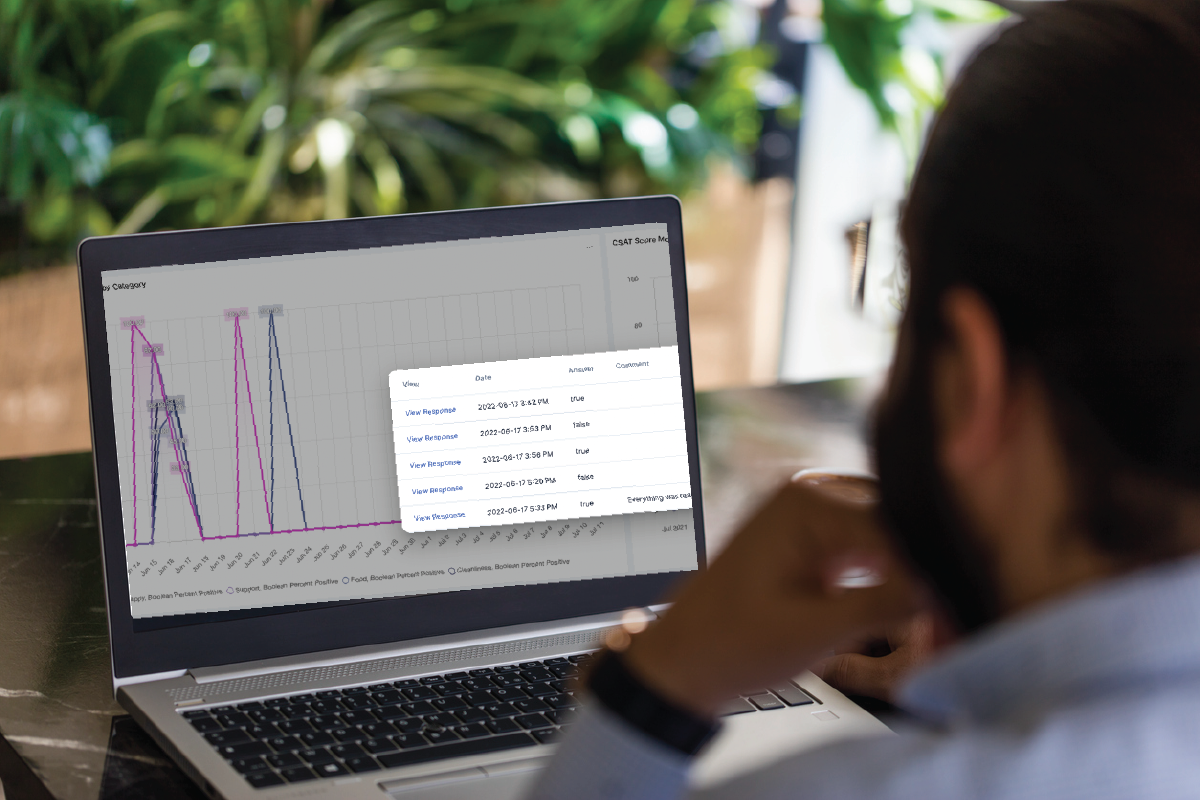
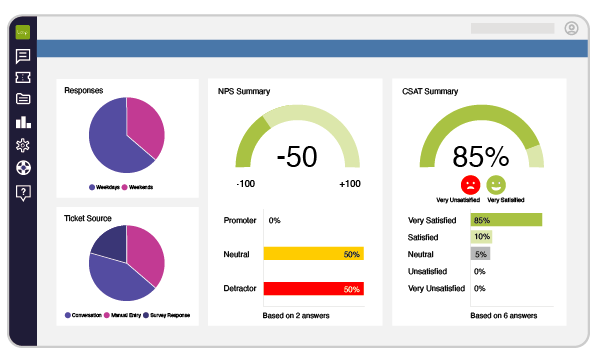
Custom Dashboards: Creating a rich dashboard with visualizations for curating surveys, conversion and ticket insights to summarize results for your CX initiatives breaking experience data down by location and/or room.
Dedicated CX Panels: Leverage dedicated panels for visualizing CX insights including NPS and CSAT in a friendly and familiar way.
Multiple Export Formats: Export results into PDF, PNG, JPEG, and CSV formats for productivity and preparing presentations for other stakeholders.
Multiple Pages and Panels: Add multiple pages and panels to your dashboards to ensure insights are curated effectively and consistently for routine review and analysis.
Secure Access: Restrict access by user including view and edit permissions to separate concerns by location, touchpoint, role ect.
Luckily Benbria’s Loop Dashboards are user friendly and provide amazing insights to your survey responses! For more information on how our Dashboard’s work click here.