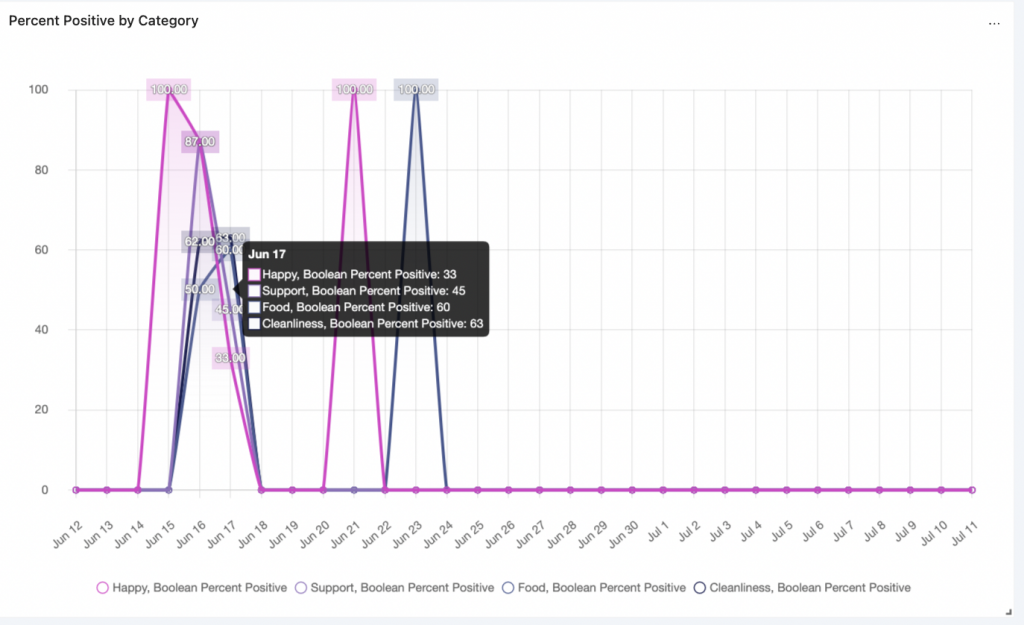
Collecting data is critical to any customer experience strategy, but what you do with that data is key to improving customer loyalty and reducing revenue churn. Loop’s custom dashboards display your survey data in an easy-to-read way, allowing you to report on your key performance metrics and make workflow changes. Whether you need to insert a graph into your presentation or download the raw data, Loop’s Dashboard Exports make it easy for you to stay close to the numbers.
With the release of Loop 4.10, we have added dashboard drill-downs, allowing you to get deeper into understanding your analytics.
The intuitive user interface allows you to click on a data point on any chart panel to see a more granular view of that given data set. From there you can navigate to the relevant survey responses that form that dataset.
Read the Help Center article on Dashboard Drill Downs.

Dashboards give you a high-level overview of your performance in each of the metrics you care about. Using Loop, you can create role-defined custom dashboards that allow each member of your team to report on the metrics that impact their area of the business.
With dashboard drill-downs, you can get into the granular data that makes up your overall data set and allow you to understand how you come up with the overall score impacting the business. Dashboard drill downs answer the “why” question, this is often what plagues most marketing and operations departments. Adding context to the data, these dashboard drill-downs give those teams the data they need to push forward initiatives that improve the overall customer experience.
Having analytics that supports your programs and initiatives allows you to be more efficient in your decision-making, as well as save time and money for the business. Knowing exactly what people are saying and analyzing trends over time is a game changer when it comes to running your customer experience programs.


