Collecting data is important to understand the voice of the customer, resolve issues as they come up and make operational decisions about the business for greater efficiencies and an improved customer experience. How you report on the data you collect to make those decisions is almost as important as the data itself.
That’s where the Loop Experience Platform will make your job much easier!
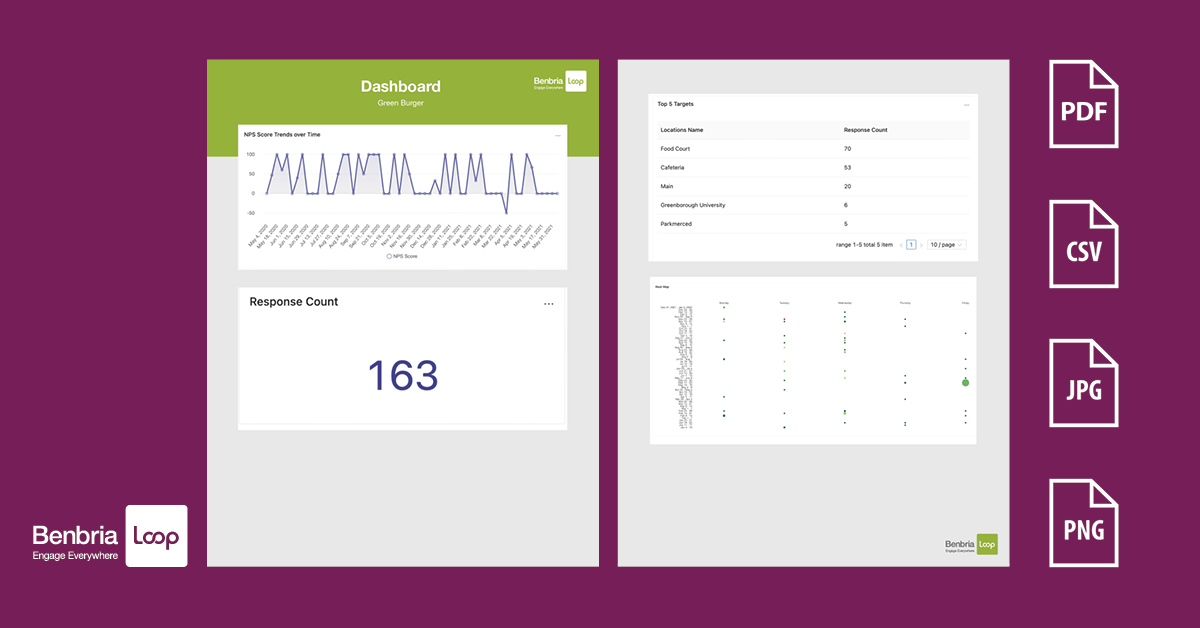
The custom dashboards within your Loop Inbox can now be exported as a PDF file to share with other stakeholder that may not have access to your Loop account. You also have the ability to export panels into PNG and JPEG files to add to presentations, or export as CSV files to analyze the raw data.
Reporting on Your KPIs using Custom Dashboards
What is the overall Customer Satisfaction (CSAT) of the food quality you provided? Did you hit your target of 85% satisfaction? What percentage of negative comments were follow-up and resolved? Which location is performing the best? Which one needs the most help? All of these questions and more can be answered using Custom Dashboards in the Loop Experience Platform.
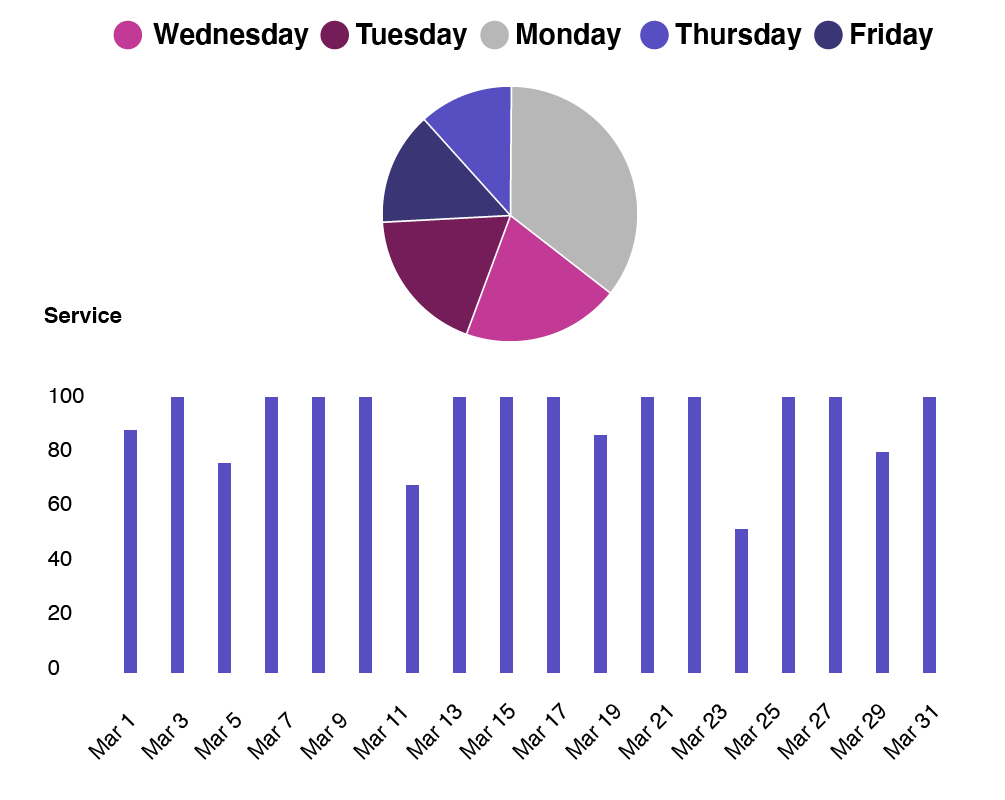
Easily report on the data that matters most to your business by creating Custom Dashboards showcasing the results of your feedback. Whether you want to look at long term trend reports or heat maps that break down your feedback by day, you can easily pinpoint the areas where you are achieving your KPIs or falling short.
Save time when putting your monthly and quarterly reports together by having the exact data you are looking for at your fingertips.
Learn more about creating Custom Dashboards in the Loop Experience Platform.
Export Your Data and Share with Stakeholders
Not every stakeholder in the organization will want to, or have access to your data in Loop. Easily keep everyone informed by creating specific dashboards catering to different members or departments within the business. Only display data that is relevant to that stakeholder, while keeping the rest of the data secured.
Whether you share information daily, weekly, monthly or quarterly with various members of the organization, save time by exporting your custom dashboards into PDF documents to distribute to the team.
Display your custom panels in presentations to stakeholders by exporting them as PNG or JPEG files to easily embed in slides and word documents. You can also export custom panels as CSV files and look at the raw data, if needed.
Explore the Benbria Help Center to get step by step instructions on How To.
Analyze Your Data Quickly and Effectively
The Loop Experience Platform has a reporting engine that makes it easy to analyze the data you are collecting from multiple locations and channels. This saves time in reporting to your executives and clients on how effective your loyalty programs are and the the overall satisfaction of the services you offer.
Get a Personalized Demo of the Loop Experience Platform Today.
Want to see it in action? Watch the quick demo video