Dashboard subscriptions are an easy way to keep your team up to date on the data that matter most- what your customers are saying about your business. Whether their job is to take care of day-to-day operations, or to analyze long-term trends in the business, use Dashboard Subscriptions in the Loop Experience Platform to be notified of the data that you’re collecting.
Having the data delivered right to your email inbox makes it easy for you to stay close to you customers.
Enabling Dashboard Subscriptions
The Loop Experience Platform provides you with Custom Dashboard options that helps you determine the data you want to see and the visualizations you want to see it in. Whether it’s a bar graph, pie chart or heat map, view the data that you’re collecting to report to your team and management about things you are excelling in, and what needs to be improved upon.
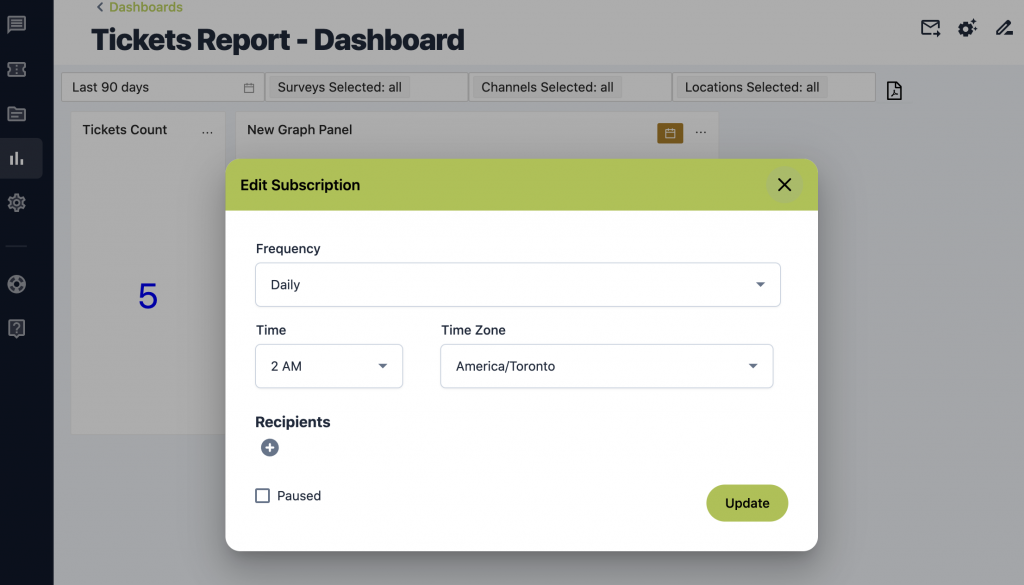
To get started with Dashboard Subscriptions go to the Dashboards section of the Loop Experience Platform and set the frequency that you would like to have your Dashboards delivered to you by email with a PDF link. This can be set to daily, weekly or monthly.
For daily reporting, you can configure the time of day you want receive your dashboard report and in which timezone. For example: if you have a team meeting on Monday morning at 11AM, you can have your dashboard data delivered to your email inbox for 9AM, so you have the most current report for your meeting.
You can also manage which users of the platform also receive these dashboards.

Learn more about setting up your Dashboard Subscriptions on our Help Center.
Receiving Your Dashboard Subscriptions
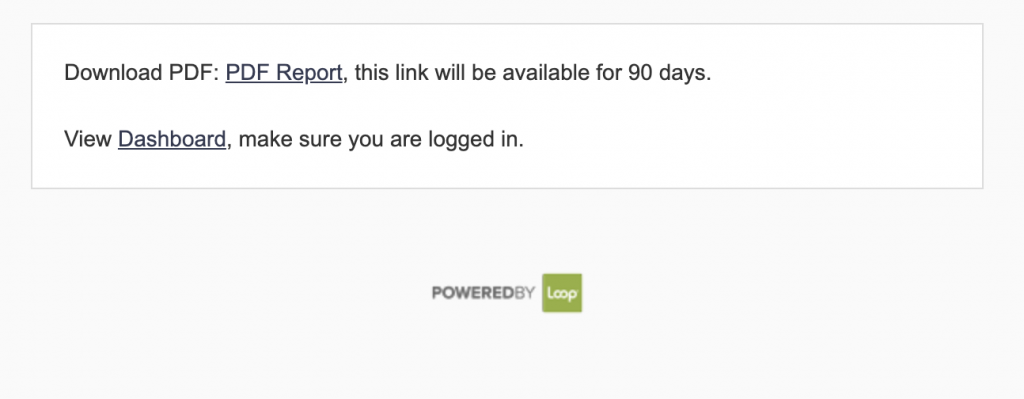
When someone is subscribed, they will receive their email at the specified time and will include a link which is valid for 90 days to download the PDF file. You can also use the link to navigate directly to the Dashboard in Loop. This email is also able to be forwarded to other person’s email and the download link will remain valid.

Using our new Dashboard Subscription feature will help you stay on top of the data that you’re collecting so you can analyze trends and make data-driven decisions for your business. We understand that not every member of the team logs into Loop every day, this helps those that don’t understand what is happening in-location.
Using our Dashboard Exports, you can also prepare presentations quickly and easily.


