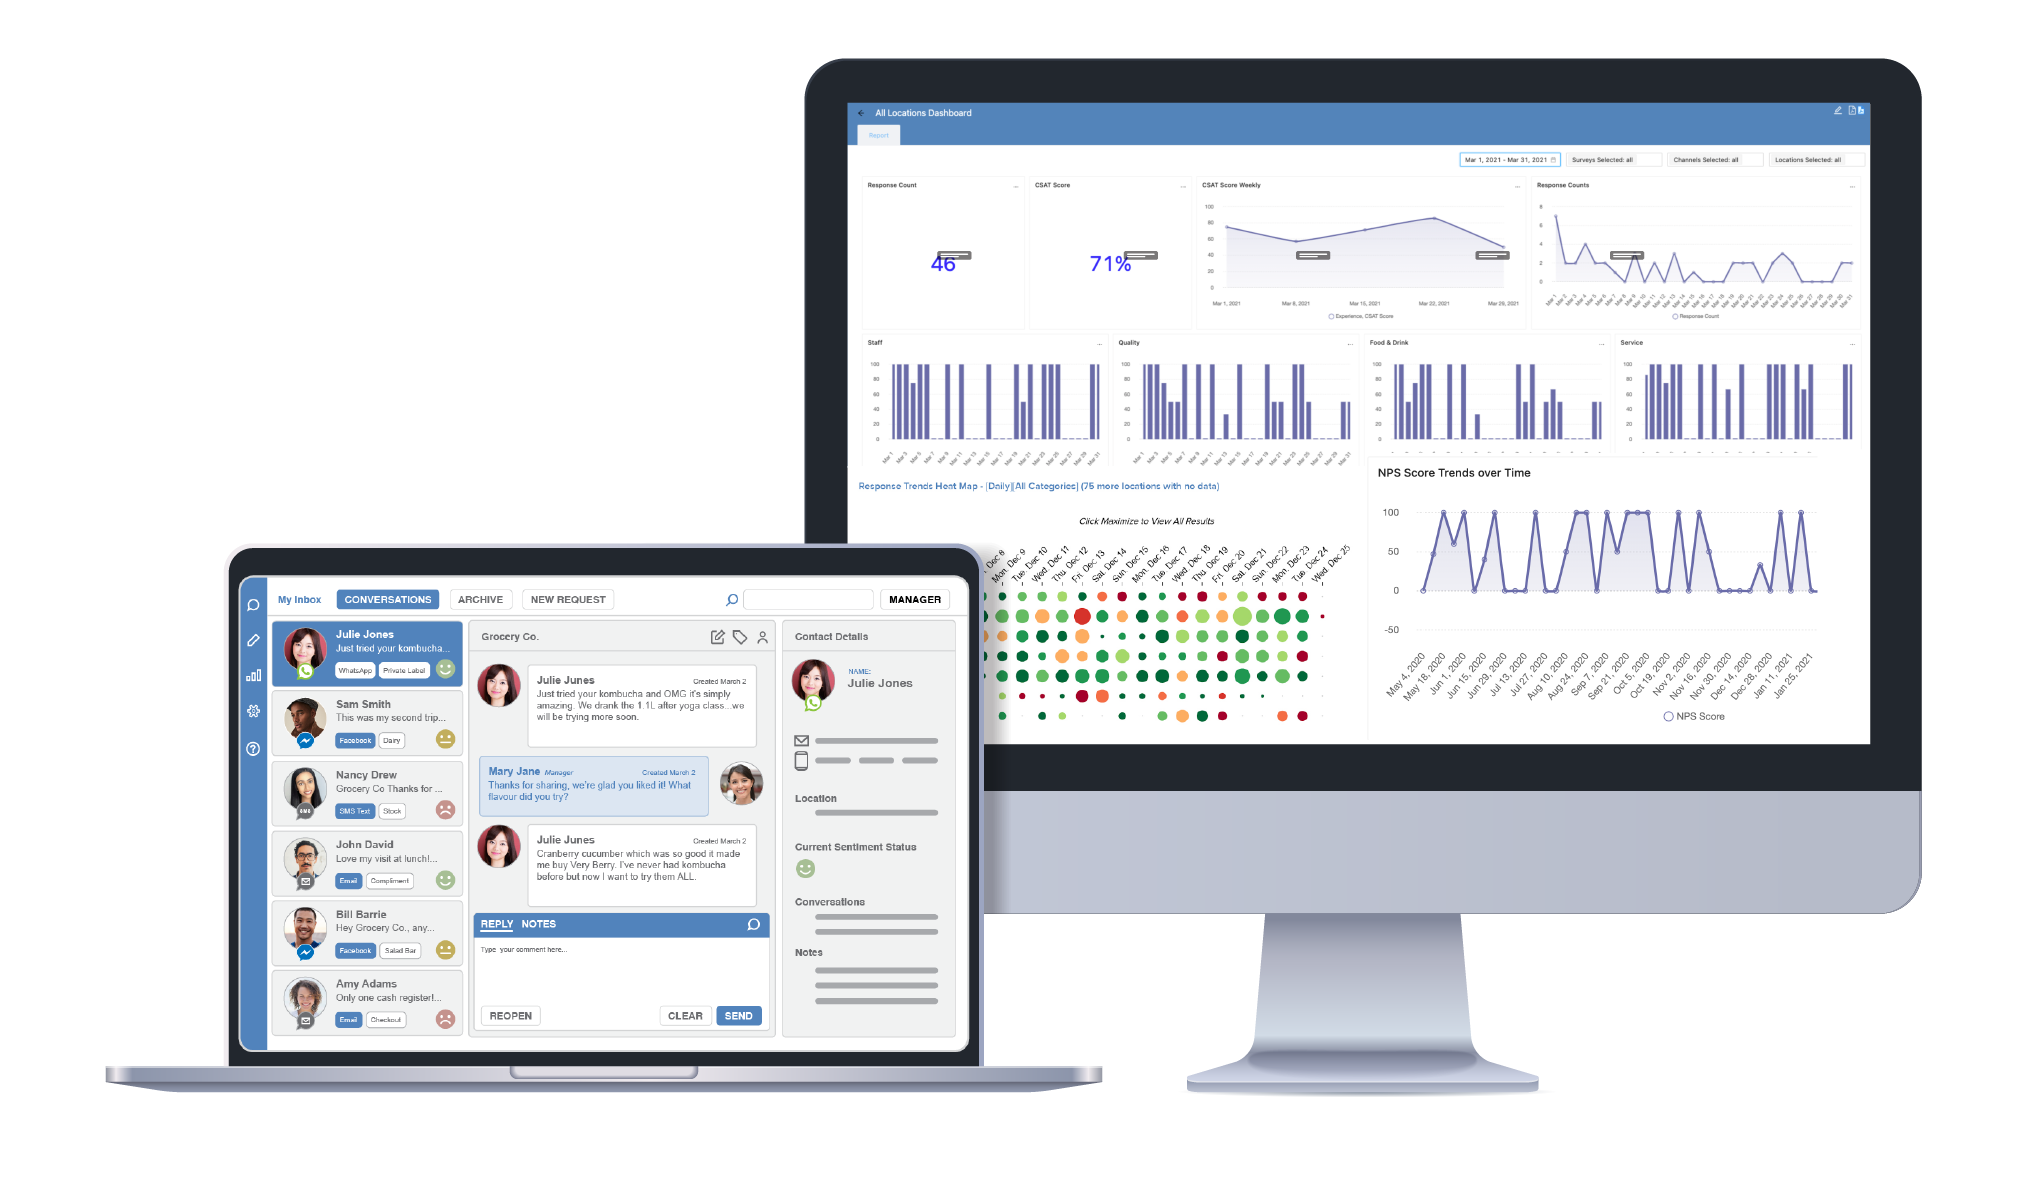
The Loop Experience Platform collects survey data and enables real-time messaging to close the loop on feedback through a powerful action management framework. One of the few location-based platforms on the market today, Loop is capable of providing an all-in-one solution that includes both feedback and real-time engagement capabilities, as well as rich analytics focused on measuring the customer experience across 10 channels of engagement.
Learn more about how the Loop Platform helps Sodexo improve food service, customer satisfaction, food quality and track KPI’s. Helping improve your customers experience and keep your clients happy with the service provided.


Net Promoter Score (NPS) – Measure Customer Loyalty and close the loop on detractors

Customer Satisfaction (CSAT) – Understand customer satisfaction as it relates to food quality and service

Customer Effort Score (CES) – Measure how much effort a customer has to put into place an order

5 Star Rating – Prompts the customer to rate an aspect of the service through selecting up to five stars.

Smilies – Simple customer satisfaction rating by choosing either happy experience or sad experience.

Thumbs – Boolean question type to simply select a thumbs up or down to indicate experience.
Real time data collection allows for quick escalation and remediation of issues. Close the loop on feedback through Loop’s action management framework.
Effective routing creates operational efficiencies and speeds up the mean time to resolution. Create a long lasting customer loyalty to your brand by addressing issues as they arise

Collect maximum feedback in high traffic areas. 4 Custom form factors to choose from.

Collect feedback both online and offline. Use QR codes for contactless communication.

Easily embed the Loop Experience Platform into your app for a seamless experience.

Manage messaging through WhatsApp, Facebook Messenger and Twitter DM.


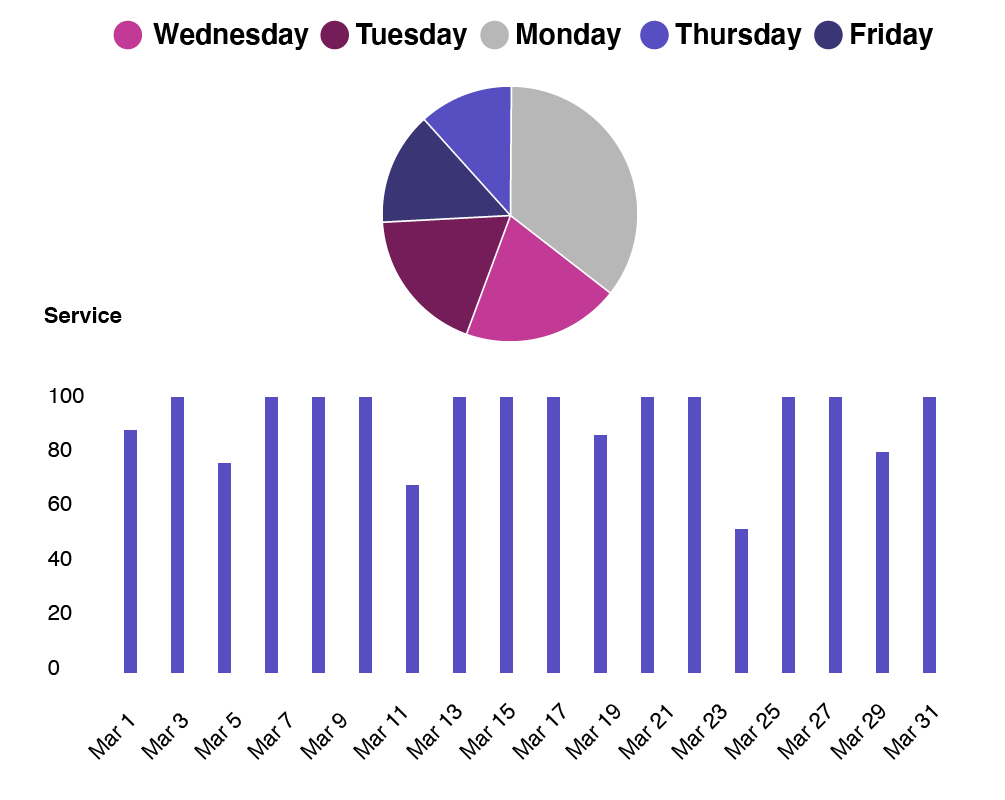
Identify trends using rich analytics from the data you collect. Pinpoint exact times, days and locations of service fluctuations to make improvements on the overall customer experience to uphold brand standards and preserve client loyalty.

Understand the data you collect at-a-glance to understand how you are trending. This allows you to make improvements to ensure you are meeting your KPIs.

Use custom dashboards to compare how you are trending by category, location, date and time range, and other metrics you are being evaluated on.

Create custom panels to identify different time ranges of your data. Whether you’re reporting quarterly, monthly, weekly, daily or hourly, these reporting tools will help.
We’ll help you measure the consumer experience throughout your entire site at all relevant touchpoints.
Filter by location, channel, survey, touchpoint, date range and other important metrics to support your MBR and QBR process.
Create categories for each area of measurement such as food, cleanliness, service and comfort to aggregate consumer experience insights on dashboards
Securely share dashboards and export into PDF format for clients in support your MBRs and QBRs.

Your time is precious. Shouldn’t you train staff on what is important versus everything? Insights from Loop allow you to focus your training and coaching activities on what needs to be improved versus everything – saving you and your team valuable time!
The insights from our platform can be used to prepare you for your quarterly business reviews. You can show statistical evidence of your performance with real-time feedback from guests, which makes it easier to demonstrate the value you bring versus the competition!
Actionable reports allow you to pinpoint the specific days and shifts where guests are less impressed with your service, food quality, and more – so you can make hiring, scheduling, or training changes with a positive impact.
Loop delivers more comments than traditional surveys. You can access an ongoing flow of positive and negative comments for learning you can immediately deploy to improve the service of your team the and overall quality of your facility.
By adding a Loop Scoreboard, your team can see the feedback from guests in real-time. It does wonders to improve morale, build a customer-centric culture, and motivate team members to go above and beyond!
Make customer experience data related to loyalty, satisfaction and effort, part of your overall culture to ensure that everyone is on the same page. Scoreboards are great for streaming live customer feedback each shift resulting in higher employee productivity and reduced customer churn.
Let your dedicated Sodexo account manager walk you through our program and show you how Loop works.
We are deployed across a variety of divisions including Corporate Services, Sports & Leisure, Healthcare, Government & Agencies and Resources & Energy.